If we improve an acoustic environment, usually we reduce noise level and reverberation time. When an unexpected situation occurs, reductions are not reached, but… Consider activities before making your conclusion!
This study was conducted in 2021 in the Customer Service Centre of ČEZ in Děčín. ČEZ Group is the biggest energy company in the Czech Republic. The customer center is located in a historical building. The size of the room is 93 m2 and the height is 3300 mm. There were 7 counters in the room originally (for the new layout with 6 counters – see picture 2) and therefore it was possible to serve 7 clients at once.
In terms of interior acoustics, there was a problem with a very high noise level in the room, which negatively affected the performance and well-being of employees. It is important to mention the limitations in which the measurement was performed. As part of anti-epidemic restrictions, the capacity of all interiors was reduced. Therefore, not all counters were always used during the monitored time. Another factor that affected the measured values was the obligation to wear a mask inside buildings. This reduced the speech intelligibility and led employees to raise their voices In addition, the counters were equipped with temporary plexiglass screens. This fact also made it necessary to speak louder.
Methodology
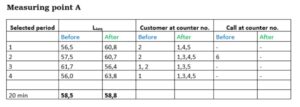
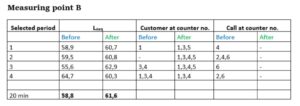
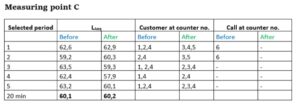
The subject of the investigation was exploratory measurements of noise levels in the customer service area between the individual counters and workplaces during the normal operation of the customer center. The measuring points are marked in red (see pictures 1 and 2). The individual measurements lasted 20 minutes, the microphone was at 1,2m high. As part of the measurements at specific points, the operation and staff activities were monitored in the room and at workplaces. It was expected to identify an increase in noise level during more concurrent activities in the room. The charts below include data before and after acoustic treatment.
The space has the following dimension: 13,6 x 6,8 x 3,3m
Acoustic treatment included installations of 8 pcs Ecophon Solo Circle Ø1200 mm, 21 pcs Ecophon Solo Circle Ø800 mm, and 32 m2 Ecophon Akusto Wall/Texona.


During the first measurement, the branch had to respect the government rules to prevent the spread of Covid-19 disease, so the occupancy of the room reached only 30-40%. An opposite situation occurred within the final investigation. Two other energy suppliers had declared bankruptcy which led to compulsion on the remaining suppliers, including CEZ. The clients of 2 bankrupted suppliers came to sign a new contract with CEZ. Due to the turbulent changes in the energy, the counters were extremely busy and the queues became outside the customer center itself. However, there were still limits due to Covid-19 for the number of individual customers in the room, so the branch occupancy reached about 70-80%. The need to wear a mask remained, which still reduced speech intelligibility as well as the installed plexiglass screens. As part of the operation, the employees primarily dealt with clients directly at the counters; phone calls did not take place compared to the previous measurement. There was a small change in the layout – see pictures 1 and 2.
Summary
The overall equivalent sound pressure level of the input measurements reached values 57,8 – 60,1 dB, while the total equivalent sound pressure level of the final measurements achieved a range of 58,8 – 61,6 dB. If we evaluate both the maximum and the minimum values of individual noise periods, we get results in the range from 55,6 to 64,7 dB for input measurements and values from 56,3 to 63,8 dB for final measurements.
It is evident that although an increase in the number of clients was registered and noise at the counters increased significantly, the results are very similar, resp. they are also lower. For this reason, it can be stated that the impact of acoustic absorbers is significant and has helped to improve the quality of the space.
How did the employees react when the acoustic treatment was installed? When the final measurement was taken, the energy market went through the crisis. The number of activities (coming from the charts above) was much higher than by the first measurement. The employees were asked to answer a questionnaire and they stated that the new acoustic environment is similar to it was before. Despite the increased number of activities, the sound pressure level was kept in the inputs values.


